Cost, it’s something that a lot of organisations struggle with when operating in the cloud.
I have authored many posts on mechanisms you can take to reduce your costs, and they broadly apply across all the hyperscalers, but as they say, sunlight is the best disinfectant.
The sunlight I am referring to is cost visibility. Something many organisations lack to implement.
The challenge in many an organisations are that engineering teams operate in the dark about their spending impact. Finance may see ballooning costs that can be hard to correlate to business outcomes.
This isn’t a technical problem. We have two parties, one that is building, pulling architectural levers and spending and then there is another party thats paying bills that are almost always not in sync with each other.
We need a means to bring these two personas together.
The genesis of this solution came during my work helping a large Australian business, they have close to 200 Azure subscriptions. Their monthly Azure bills aren’t easily reconcilable to engineering teams and broadly speaking, engineering teams are only happy to adjust patterns when notified.
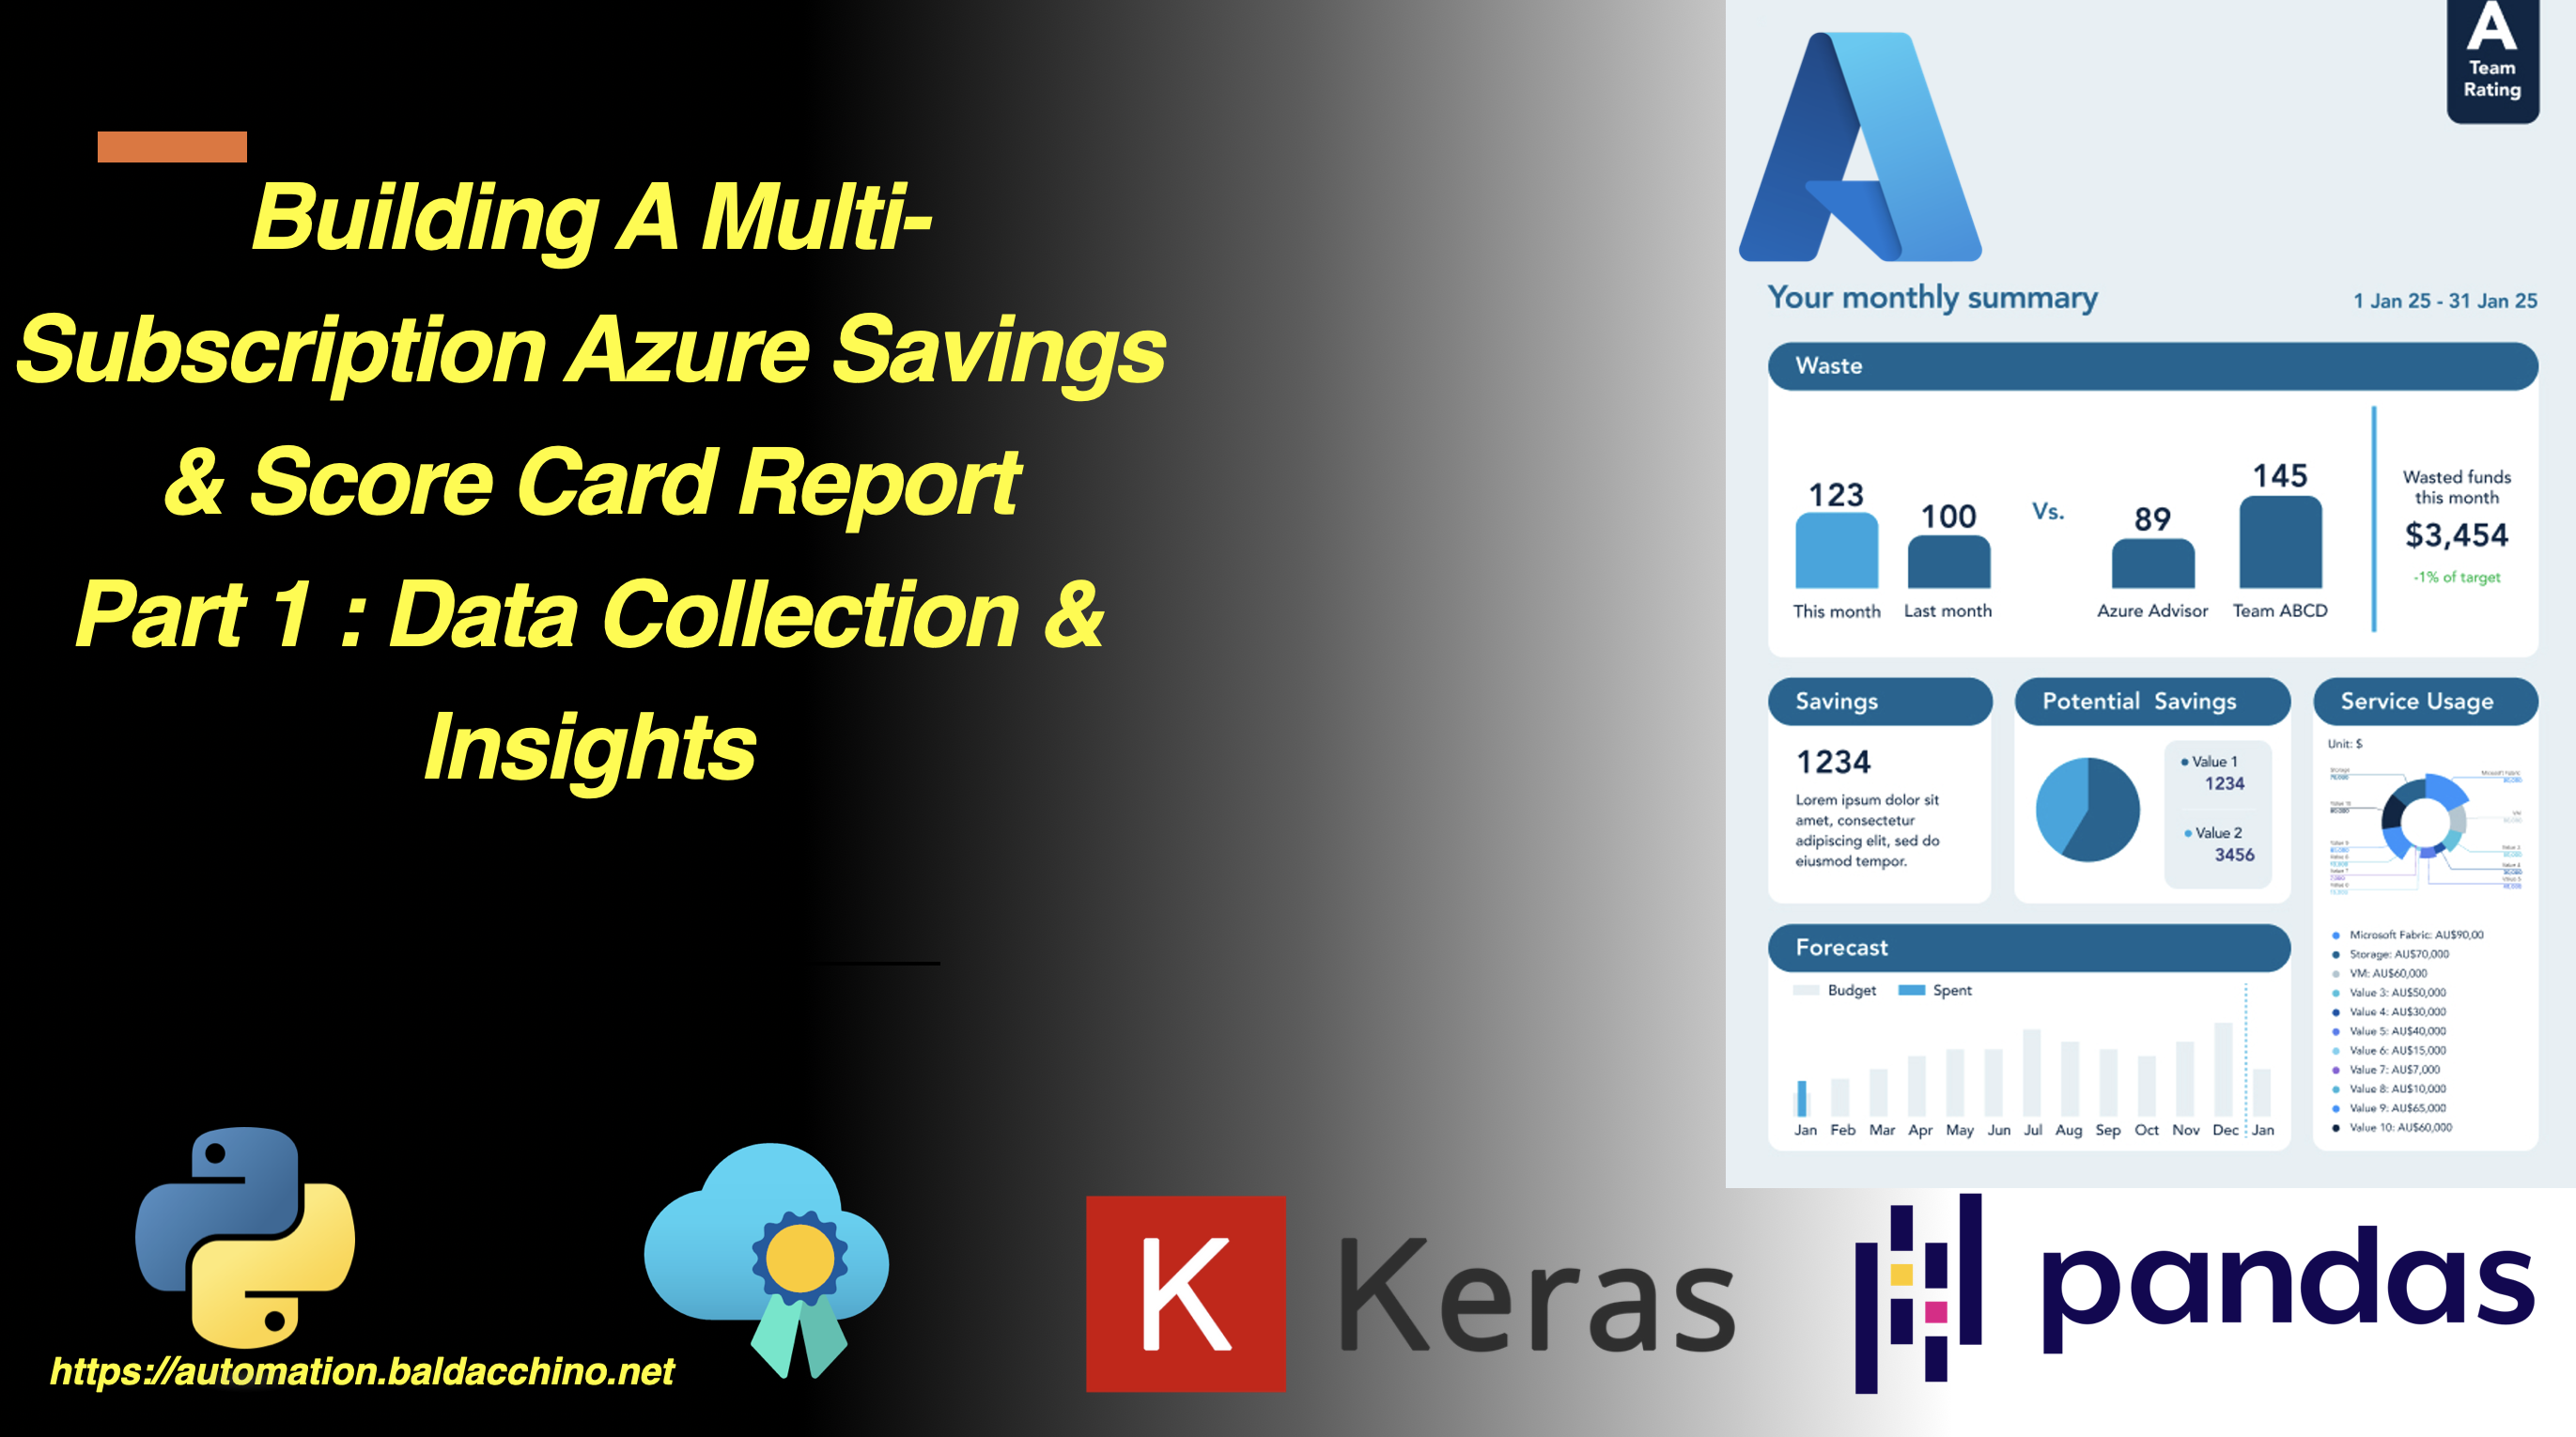
What if technical teams at the Azure subscription level could receive a monthly bill, showing them their top used services, how their spend compares against other teams and the potential savings they could make against their stack?
That’s what we want.

So in this blog post series I will show you how I was able to harvest data, analyse and then visualise
You may be thinking, Microsoft environment, why dont you use Power BI or Fabric. The challenge here is multiple
- The Data I Need : The data I need is a combination of cost and billing data, Azure Advisor and Azure Monitor.
- Look & Feel : These reports speak Microsoft’s design language. Python graces us the utmost flexibility
- Cost : The over arching aim is to save money, using either of the above does not help my cause.
This post can be broken in to a few key steps
- Harvesting Data From Azure (Cost API + Advisor + Monitor)
- Drawing Insights With Python (Keras + Pandas)
- Visualisation
Harvesting Data From Azure
The first step in this multi step process is to harvest data. I want this to look like a bill and if i visualise a bill from my energy retails (electricity) the first thing I want to see is my history. This means we need to look back months, in my case is 6 months. There are challenges in this. Hitting Azure’s API’s too hard will result in HTTP 429 errors as you can see in my example below.
Please ensure you run an az login prior to executing this code
2025-07-26 20:20:10.989 [INFO   ] Initializing Azure credentials...
2025-07-26 20:20:10.991 [DEBUG  ] Connecting to SubscriptionClient...
2025-07-26 20:20:10.991 [INFO   ] Calculating date ranges for cost analysis...
2025-07-26 20:20:10.991 [DEBUG  ] Generated date range: 2025-02-01 to 2025-02-28 (0.000s)
2025-07-26 20:20:10.991 [DEBUG  ] Generated date range: 2025-03-01 to 2025-03-31 (0.000s)
2025-07-26 20:20:10.991 [DEBUG  ] Generated date range: 2025-04-01 to 2025-04-30 (0.000s)
2025-07-26 20:20:10.991 [DEBUG  ] Generated date range: 2025-05-01 to 2025-05-31 (0.000s)
2025-07-26 20:20:10.991 [DEBUG  ] Generated date range: 2025-06-01 to 2025-06-30 (0.000s)
2025-07-26 20:20:10.991 [DEBUG  ] Generated date range: 2025-07-01 to 2025-07-31 (0.000s)
2025-07-26 20:20:10.991 [INFO   ] Processing 6 months: ['Feb 2025', 'Mar 2025', 'Apr 2025', 'May 2025', 'Jun 2025', 'Jul 2025']
2025-07-26 20:20:10.991 [INFO   ] Initializing output file: azure_cost_report.csv
2025-07-26 20:20:10.992 [DEBUG  ] Writing CSV headers: ['Subscription ID', 'Subscription Name', 'Advisor Score', 'Est. Monthly Savings', 'Feb 2025 Cost', 'Mar 2025 Cost', 'Apr 2025 Cost', 'May 2025 Cost', 'Jun 2025 Cost', 'Jul 2025 Cost', 'Top 5 Services (Current Month)']
2025-07-26 20:20:13.743 [INFO   ] Found 1 subscriptions to process
2025-07-26 20:20:13.743 [DEBUG  ]
############################################################
2025-07-26 20:20:13.743 [INFO   ] PROCESSING SUBSCRIPTION 1/1
2025-07-26 20:20:13.743 [INFO   ] Display Name: Baldacchino - Personal
2025-07-26 20:20:13.743 [DEBUG  ] Subscription ID: xxxxxxxxxx
2025-07-26 20:20:13.743 [DEBUG  ] Processing Started: 20:20:13
2025-07-26 20:20:13.743 [INFO   ] Initializing Advisor recommendations analysis...
2025-07-26 20:20:13.744 [DEBUG  ] Fetching recommendations...
2025-07-26 20:20:14.983 [INFO   ] Retrieved 2 recommendations in 1.24s
2025-07-26 20:20:14.983 [INFO   ] Analyzing cost recommendations...
2025-07-26 20:20:14.983 [DEBUG  ] Recommendation properties: {'recommendationSubCategory': 'MonitoringAndAlerting', 'maturityLevel': 'GA', 'recommendationOfferingId': 'ed05f3b7-8949-4698-9b38-49ab8abb5ee0'}
2025-07-26 20:20:14.983 [DEBUG  ] Skipping non-cost recommendation: /subscriptions/8c2771cb-048c-401c-a465-3936aee29f05/providers/Microsoft.Advisor/recommendations/09fe3804-16f9-6077-4c40-2632b45392a2
2025-07-26 20:20:14.983 [DEBUG  ] Recommendation properties: {'region': 'eastus', 'recommendationSubCategory': 'HighAvailability', 'maturityLevel': 'GA', 'recommendationOfferingId': '021d60de-795e-468a-953b-cb0067f8542e'}
2025-07-26 20:20:14.983 [DEBUG  ] Skipping non-cost recommendation: /subscriptions/8c2771cb-048c-401c-a465-3936aee29f05/resourcegroups/baldacchino_personal/providers/microsoft.network/virtualnetworks/ubuntupremssdv2-vnet/providers/Microsoft.Advisor/recommendations/53c869a3-f373-d793-5721-68e7b225c836
2025-07-26 20:20:14.983 [INFO   ] Cost analysis completed - 0 relevant recommendations
2025-07-26 20:20:14.983 [DEBUG  ] Savings Breakdown:
  Annual Conversions: 0 recs ($0.00)
  Direct Monthly: 0 recs ($0.00)
  Generic Savings: 0 recs ($0.00)
2025-07-26 20:20:14.983 [INFO   ] No cost recommendations for scoring
2025-07-26 20:20:14.983 [INFO   ]
Starting historical cost analysis...
2025-07-26 20:20:14.984 [INFO   ] Processing month 1/6: Feb 2025
2025-07-26 20:20:14.984 [DEBUG  ] Executing cost query for Feb 2025...
2025-07-26 20:20:14.984 [DEBUG  ] Initiating Cost Query Feb 2025...
Datetime with no tzinfo will be considered UTC.
Datetime with no tzinfo will be considered UTC.
2025-07-26 20:20:20.424 [DEBUG  ] Cost Query Feb 2025 succeeded in 5.44s (attempt 1)
2025-07-26 20:20:20.425 [DEBUG  ] Retrieved cost data: $2.17
2025-07-26 20:20:20.425 [INFO   ] Month Feb 2025 cost: $2.17
2025-07-26 20:20:20.425 [DEBUG  ] Month 1/6 completed in 5.44s - Waiting 2.8s
2025-07-26 20:20:23.247 [INFO   ] Processing month 2/6: Mar 2025
2025-07-26 20:20:23.247 [DEBUG  ] Executing cost query for Mar 2025...
2025-07-26 20:20:23.247 [DEBUG  ] Initiating Cost Query Mar 2025...
Datetime with no tzinfo will be considered UTC.
Datetime with no tzinfo will be considered UTC.
2025-07-26 20:20:26.292 [DEBUG  ] Cost Query Mar 2025 succeeded in 3.04s (attempt 1)
2025-07-26 20:20:26.292 [DEBUG  ] Retrieved cost data: $8.72
2025-07-26 20:20:26.292 [INFO   ] Month Mar 2025 cost: $8.72
2025-07-26 20:20:26.292 [DEBUG  ] Month 2/6 completed in 3.05s - Waiting 4.0s
2025-07-26 20:20:30.261 [INFO   ] Processing month 3/6: Apr 2025
2025-07-26 20:20:30.261 [DEBUG  ] Executing cost query for Apr 2025...
2025-07-26 20:20:30.261 [DEBUG  ] Initiating Cost Query Apr 2025...
Datetime with no tzinfo will be considered UTC.
Datetime with no tzinfo will be considered UTC.
2025-07-26 20:20:33.488 [DEBUG  ] Cost Query Apr 2025 succeeded in 3.23s (attempt 1)
2025-07-26 20:20:33.488 [DEBUG  ] Retrieved cost data: $5.00
2025-07-26 20:20:33.488 [INFO   ] Month Apr 2025 cost: $5.00
2025-07-26 20:20:33.488 [DEBUG  ] Month 3/6 completed in 3.23s - Waiting 2.7s
2025-07-26 20:20:36.228 [INFO   ] Processing month 4/6: May 2025
2025-07-26 20:20:36.228 [DEBUG  ] Executing cost query for May 2025...
2025-07-26 20:20:36.229 [DEBUG  ] Initiating Cost Query May 2025...
Datetime with no tzinfo will be considered UTC.
Datetime with no tzinfo will be considered UTC.
2025-07-26 20:20:38.865 [DEBUG  ] Cost Query May 2025 succeeded in 2.64s (attempt 1)
2025-07-26 20:20:38.865 [DEBUG  ] Retrieved cost data: $7.94
2025-07-26 20:20:38.865 [INFO   ] Month May 2025 cost: $7.94
2025-07-26 20:20:38.865 [DEBUG  ] Month 4/6 completed in 2.64s - Waiting 3.3s
2025-07-26 20:20:42.173 [INFO   ] Processing month 5/6: Jun 2025
2025-07-26 20:20:42.173 [DEBUG  ] Executing cost query for Jun 2025...
2025-07-26 20:20:42.173 [DEBUG  ] Initiating Cost Query Jun 2025...
Datetime with no tzinfo will be considered UTC.
Datetime with no tzinfo will be considered UTC.
2025-07-26 20:20:43.071 [WARNING] RATE LIMIT: Cost Query Jun 2025 | Attempt 1/10 | Retry in 3.5s | Error: (429) Too many requests. Please retry.
Code: 429
Message: Too many requests. Please retry.
Datetime with no tzinfo will be considered UTC.
Datetime with no tzinfo will be considered UTC.
2025-07-26 20:20:48.024 [WARNING] RATE LIMIT: Cost Query Jun 2025 | Attempt 2/10 | Retry in 8.6s | Error: (429) Too many requests. Please retry.
Code: 429
Message: Too many requests. Please retry.
Datetime with no tzinfo will be considered UTC.
Datetime with no tzinfo will be considered UTC.
2025-07-26 20:20:57.931 [WARNING] RATE LIMIT: Cost Query Jun 2025 | Attempt 3/10 | Retry in 12.2s | Error: (429) Too many requests. Please retry.
Code: 429
Message: Too many requests. Please retry.
Datetime with no tzinfo will be considered UTC.
Datetime with no tzinfo will be considered UTC.
2025-07-26 20:21:11.135 [WARNING] RATE LIMIT: Cost Query Jun 2025 | Attempt 4/10 | Retry in 24.3s | Error: (429) Too many requests. Please retry.
Code: 429
Message: Too many requests. Please retry.
Datetime with no tzinfo will be considered UTC.
Datetime with no tzinfo will be considered UTC.
2025-07-26 20:21:40.536 [DEBUG  ] Cost Query Jun 2025 succeeded in 5.06s (attempt 5)
2025-07-26 20:21:40.536 [DEBUG  ] Retrieved cost data: $2.20
2025-07-26 20:21:40.536 [INFO   ] Month Jun 2025 cost: $2.20
2025-07-26 20:21:40.536 [DEBUG  ] Month 5/6 completed in 58.36s - Waiting 3.0s
2025-07-26 20:21:43.499 [INFO   ] Processing month 6/6: Jul 2025
2025-07-26 20:21:43.500 [DEBUG  ] Executing cost query for Jul 2025...
2025-07-26 20:21:43.500 [DEBUG  ] Initiating Cost Query Jul 2025...
Datetime with no tzinfo will be considered UTC.
Datetime with no tzinfo will be considered UTC.
2025-07-26 20:21:46.522 [DEBUG  ] Cost Query Jul 2025 succeeded in 3.02s (attempt 1)
2025-07-26 20:21:46.522 [DEBUG  ] Retrieved cost data: $1.82
2025-07-26 20:21:46.522 [INFO   ] Month Jul 2025 cost: $1.82
2025-07-26 20:21:46.522 [DEBUG  ] Month 6/6 completed in 3.02s - Waiting 2.6s
2025-07-26 20:21:49.156 [INFO   ]
Analyzing service costs for current month...
2025-07-26 20:21:49.157 [DEBUG  ] Executing service breakdown query...
2025-07-26 20:21:49.157 [DEBUG  ] Initiating Service Breakdown...
Datetime with no tzinfo will be considered UTC.
Datetime with no tzinfo will be considered UTC.
2025-07-26 20:21:52.138 [DEBUG  ] Service Breakdown succeeded in 2.98s (attempt 1)
2025-07-26 20:21:52.138 [INFO   ] Top services identified: Azure DNS ($1.41), Storage ($0.41)
2025-07-26 20:21:52.138 [INFO   ]
Finalizing data for CSV export...
2025-07-26 20:21:52.138 [DEBUG  ] Writing CSV row: ['8c2771cb-048c-401c-a465-3936aee29f05', 'Baldacchino - Personal', 'N/A', 0.0, 2.17, 8.72, 5.0, 7.94, 2.2, 1.82, 'Azure DNS ($1.41), Storage ($0.41)']
2025-07-26 20:21:52.139 [INFO   ] Data successfully committed to CSV
2025-07-26 20:21:52.139 [INFO   ] Subscription completed in 98.4s
Progress: 1/1 (100.0%)
Elapsed: 1.7m | ETA: 0.0m | Remaining: 0 subs
2025-07-26 20:21:52.140 [INFO   ]
============================================================
2025-07-26 20:21:52.140 [INFO   ] PROCESSING COMPLETE
2025-07-26 20:21:52.140 [INFO   ] Total subscriptions processed: 1
2025-07-26 20:21:52.140 [INFO   ] Total execution time: 101.1s (1.7m)
2025-07-26 20:21:52.140 [INFO   ] Output file: azure_cost_report.csv
2025-07-26 20:21:52.140 [INFO   ] ============================================================
(3.11.8) baldacchino_admin@Shanes-MacBook-Pro %
Progress: 1/1 (100.0%)
Elapsed: 1.7m | ETA: 0.0m | Remaining: 0 subs
2025-07-26 20:21:52.140 [INFO   ]


You will see in the code below I am implementing exponential back offs. This is needed.
This code will
- Enumerate every subscription
- Advisor : Set the scope of Azure Advisor to the Subscription Level
- Retrieve the set of recommendations from Azure Advisor and calculate the savings per recommendation and calculate total savings
- Cost History : Calculate past 6 months costs broken down month
- Exponential back-offs are required as this process requires multiple calls to the Azure Cost API
- Top 5 Services : Current months cost is broken down in to Azure Service Families, showing the service families (Compute etc) that make up the main subscription costs
- Advisor : Set the scope of Azure Advisor to the Subscription Level
This code will take some time to run. In 150 subscriptions it takes close to 4 hours run time. It will create a CSV upon competition called ‘azure_cost_report.csv‘. This CSV containers the raw data
import csv
import time
import random
from datetime import datetime
from dateutil.relativedelta import relativedelta
from azure.identity import DefaultAzureCredential
from azure.mgmt.resource import SubscriptionClient
from azure.mgmt.costmanagement import CostManagementClient
from azure.mgmt.advisor import AdvisorManagementClient
from azure.core.exceptions import HttpResponseError

# Configuration
MAX_RETRIES = 10
INITIAL_DELAY = 2.0
MAX_DELAY = 60.0
JITTER_FACTOR = 0.3
VERBOSE_LOGGING = True

def log(message, level="INFO", verbose=False):
    """Enhanced logging with verbosity control and microsecond precision"""
    if verbose and not VERBOSE_LOGGING:
        return
    timestamp = datetime.now().strftime("%Y-%m-%d %H:%M:%S.%f")[:-3]
    print(f"{timestamp} [{level.ljust(7)}] {message}")

def exponential_backoff(retries):
    """Calculate backoff delay with jitter"""
    delay = min(INITIAL_DELAY * (2 ** retries), MAX_DELAY)
    jitter = delay * JITTER_FACTOR * random.uniform(-1, 1)
    return max(delay + jitter, 0.1)

def query_with_retry(client, scope, query_params, operation_name):
    """Execute query with detailed retry logging"""
    log(f"Initiating {operation_name}...", "DEBUG", verbose=True)
    for attempt in range(1, MAX_RETRIES+1):
        try:
            attempt_start = time.time()
            result = client.query.usage(scope=scope, parameters=query_params)
            elapsed = time.time() - attempt_start
            log(f"{operation_name} succeeded in {elapsed:.2f}s (attempt {attempt})", "DEBUG", verbose=True)
            return result
        except HttpResponseError as e:
            if e.status_code == 429:
                delay = exponential_backoff(attempt)
                log((f"RATE LIMIT: {operation_name} | "
                     f"Attempt {attempt}/{MAX_RETRIES} | "
                     f"Retry in {delay:.1f}s | "
                     f"Error: {e.message}"), "WARNING")
                time.sleep(delay)
                continue
            log(f"HTTP Error {e.status_code}: {e.message}", "ERROR")
            raise
        except Exception as e:
            log(f"Critical failure during {operation_name}: {str(e)}", "CRITICAL")
            raise
    return None

def format_currency(amount):
    """Format currency with thousands separators"""
    return f"${amount:,.2f}"

# Main execution flow
log("Initializing Azure credentials...", "INFO")
credential = DefaultAzureCredential()

log("Connecting to SubscriptionClient...", "DEBUG", verbose=True)
subscription_client = SubscriptionClient(credential)

# Generate 6-month date ranges
log("Calculating date ranges for cost analysis...", "INFO")
today = datetime.utcnow()
six_months = []
for i in range(5, -1, -1):
    calculation_start = time.time()
    target_date = today - relativedelta(months=i)
    first_day = target_date.replace(day=1, hour=0, minute=0, second=0, microsecond=0)
    last_day = (first_day + relativedelta(months=1)) - relativedelta(days=1)
    six_months.append({
        'name': first_day.strftime("%b %Y"),
        'start': first_day,
        'end': last_day
    })
    log(f"Generated date range: {first_day.date()} to {last_day.date()} ({time.time()-calculation_start:.3f}s)",
        "DEBUG", verbose=True)

log(f"Processing {len(six_months)} months: {[m['name'] for m in six_months]}", "INFO")

# CSV Setup
CSV_PATH = 'azure_cost_report.csv'
log(f"Initializing output file: {CSV_PATH}", "INFO")
with open(CSV_PATH, 'w', newline='', buffering=1) as csv_file:
    writer = csv.writer(csv_file)

    # Build headers
    headers = [
        'Subscription ID',
        'Subscription Name',
        'Advisor Score',
        'Est. Monthly Savings'
    ]
    headers += [f"{m['name']} Cost" for m in six_months]
    headers.append('Top 5 Services (Current Month)')

    log(f"Writing CSV headers: {headers}", "DEBUG", verbose=True)
    writer.writerow(headers)
    csv_file.flush()

    total_subscriptions = 0
    global_start = time.time()
    subscription_list = list(subscription_client.subscriptions.list())

    log(f"Found {len(subscription_list)} subscriptions to process", "INFO")

    for sub in subscription_list:
        sub_id = sub.subscription_id
        sub_name = sub.display_name
        total_subscriptions += 1
        sub_start = time.time()

        log(f"\n{'#' * 60}", "DEBUG", verbose=True)
        log(f"PROCESSING SUBSCRIPTION {total_subscriptions}/{len(subscription_list)}", "INFO")
        log(f"Display Name: {sub_name}", "INFO")
        log(f"Subscription ID: {sub_id}", "DEBUG", verbose=True)
        log(f"Processing Started: {datetime.now().strftime('%H:%M:%S')}", "DEBUG", verbose=True)

        # Advisor Recommendations Analysis
        log("Initializing Advisor recommendations analysis...", "INFO")
        advisor_client = AdvisorManagementClient(credential, sub_id)
        cost_recommendations = []
        total_monthly_savings = 0.0
        cost_score = "N/A"

        try:
            log("Fetching recommendations...", "DEBUG", verbose=True)
            rec_start = time.time()
            recommendations = list(advisor_client.recommendations.list())
            rec_duration = time.time() - rec_start
            log(f"Retrieved {len(recommendations)} recommendations in {rec_duration:.2f}s", "INFO")

            savings_breakdown = {
                'annual': {'count': 0, 'amount': 0.0},
                'monthly': {'count': 0, 'amount': 0.0},
                'generic': {'count': 0, 'amount': 0.0}
            }

            log("Analyzing cost recommendations...", "INFO")
            # In the recommendation processing loop:
            for idx, recommendation in enumerate(recommendations, 1):
                try:
                    props = getattr(recommendation, 'extended_properties', {}) or {}
                    log(f"Recommendation properties: {props}", "DEBUG", verbose=True)

                    # Validate savings fields
                    valid_saving_keys = ['savingsAmount', 'annualSavingsAmount', 'monthlySavingsAmount']
                    has_valid_savings = any(float(props.get(k, 0)) > 0 for k in valid_saving_keys if k in props)

                    if recommendation.category == 'Cost' and has_valid_savings:
                        cost_recommendations.append(recommendation)

                        # Log recommendation details
                        if hasattr(recommendation, 'short_description') and hasattr(recommendation.short_description, 'text'):
                            desc = recommendation.short_description.text
                        else:
                            desc = "No description available"
                        log(f"Cost Recommendation {idx}: {desc}", "INFO")

                        # Detailed savings processing
                        try:
                            savings = 0.0
                            if 'annualSavingsAmount' in props:
                                savings = float(props['annualSavingsAmount']) / 12
                                savings_breakdown['annual']['count'] += 1
                            elif 'monthlySavingsAmount' in props:
                                savings = float(props['monthlySavingsAmount'])
                                savings_breakdown['monthly']['count'] += 1
                            elif 'savingsAmount' in props:
                                savings = float(props['savingsAmount'])
                                savings_breakdown['generic']['count'] += 1

                            total_monthly_savings += savings
                            log(f"Applied savings: {format_currency(savings)}", "DEBUG", verbose=True)

                        except Exception as e:
                            log(f"Failed to process savings for recommendation {recommendation.id}: {str(e)}", "ERROR")

                    else:
                        log(f"Skipping non-cost recommendation: {recommendation.id}", "DEBUG", verbose=True)

                except Exception as e:
                    log(f"General error processing recommendation {idx}: {str(e)}", "ERROR")

            log(f"Cost analysis completed - {len(cost_recommendations)} relevant recommendations", "INFO")
            log(("Savings Breakdown:\n"
                 f"  Annual Conversions: {savings_breakdown['annual']['count']} recs ({format_currency(savings_breakdown['annual']['amount'])})\n"
                 f"  Direct Monthly: {savings_breakdown['monthly']['count']} recs ({format_currency(savings_breakdown['monthly']['amount'])})\n"
                 f"  Generic Savings: {savings_breakdown['generic']['count']} recs ({format_currency(savings_breakdown['generic']['amount'])})"),
                 "DEBUG", verbose=True)

            # Impact score calculation
            if cost_recommendations:
                log("Calculating Advisor impact score...", "DEBUG", verbose=True)
                impact_levels = {'High': 3, 'Medium': 2, 'Low': 1}
                try:
                    cost_score = max(
                        cost_recommendations,
                        key=lambda x: impact_levels.get(getattr(x, 'impact', 'Low'), 0)
                    ).impact
                    log(f"Determined Advisor score: {cost_score}", "INFO")
                except Exception as e:
                    log(f"Score calculation error: {str(e)}", "ERROR")
                    cost_score = "Error"
            else:
                log("No cost recommendations for scoring", "INFO")

        except Exception as e:
            log(f"Advisor processing failed: {str(e)}", "ERROR")

        # Cost Data Collection
        log("\nStarting historical cost analysis...", "INFO")
        cost_client = CostManagementClient(credential)
        monthly_costs = []

        for month_idx, month in enumerate(six_months, 1):
            month_start = time.time()
            log(f"Processing month {month_idx}/6: {month['name']}", "INFO")

            try:
                query = {
                    "type": "Usage",
                    "timeframe": "Custom",
                    "timePeriod": {
                        "from": month['start'],
                        "to": month['end']
                    },
                    "dataset": {
                        "granularity": "None",
                        "aggregation": {
                            "totalCost": {
                                "name": "PreTaxCost",
                                "function": "Sum"
                            }
                        }
                    }
                }

                log(f"Executing cost query for {month['name']}...", "DEBUG", verbose=True)
                result = query_with_retry(
                    cost_client,
                    f"/subscriptions/{sub_id}",
                    query,
                    f"Cost Query {month['name']}"
                )

                if result and result.rows:
                    cost = sum(row[0] for row in result.rows)
                    log(f"Retrieved cost data: {format_currency(cost)}", "DEBUG", verbose=True)
                else:
                    cost = 0.0
                    log("No cost data available", "WARNING")

                monthly_costs.append(round(cost, 2))
                log(f"Month {month['name']} cost: {format_currency(cost)}", "INFO")

            except Exception as e:
                monthly_costs.append(0.0)
                log(f"Month {month['name']} failed: {str(e)}", "ERROR")

            finally:
                delay = random.uniform(1.5, 4.0)
                log(f"Month {month_idx}/6 completed in {time.time()-month_start:.2f}s - Waiting {delay:.1f}s", "DEBUG", verbose=True)
                time.sleep(delay)

        # Service Breakdown Analysis
        log("\nAnalyzing service costs for current month...", "INFO")
        current_month = six_months[-1]
        top_services = []

        try:
            service_query = {
                "type": "Usage",
                "timeframe": "Custom",
                "timePeriod": {
                    "from": current_month['start'],
                    "to": current_month['end']
                },
                "dataset": {
                    "granularity": "None",
                    "aggregation": {
                        "totalCost": {
                            "name": "PreTaxCost",
                            "function": "Sum"
                        }
                    },
                    "grouping": [
                        {
                            "type": "Dimension",
                            "name": "ServiceName"
                        }
                    ]
                }
            }

            log("Executing service breakdown query...", "DEBUG", verbose=True)
            result = query_with_retry(
                cost_client,
                f"/subscriptions/{sub_id}",
                service_query,
                "Service Breakdown"
            )

            if result and result.rows:
                sorted_services = sorted(result.rows, key=lambda x: x[0], reverse=True)[:5]
                top_services = [f"{svc[1]} ({format_currency(svc[0])})" for svc in sorted_services]
                log(f"Top services identified: {', '.join(top_services)}", "INFO")
            else:
                log("No service breakdown data available", "WARNING")

        except Exception as e:
            log(f"Service analysis failed: {str(e)}", "ERROR")

        # CSV Writing
        log("\nFinalizing data for CSV export...", "INFO")
        csv_row = [
            sub_id,
            sub_name,
            cost_score,
            round(total_monthly_savings, 2),
            *monthly_costs,
            ", ".join(top_services) if top_services else "No data"
        ]

        log(f"Writing CSV row: {csv_row}", "DEBUG", verbose=True)
        writer.writerow(csv_row)
        csv_file.flush()
        log("Data successfully committed to CSV", "INFO")

        # Progress Tracking
        sub_elapsed = time.time() - sub_start
        total_elapsed = time.time() - global_start
        avg_time_per_sub = total_elapsed / total_subscriptions
        remaining_subs = len(subscription_list) - total_subscriptions
        eta = avg_time_per_sub * remaining_subs

        log((
            f"Subscription completed in {sub_elapsed:.1f}s\n"
            f"Progress: {total_subscriptions}/{len(subscription_list)} "
            f"({(total_subscriptions/len(subscription_list)*100):.1f}%)\n"
            f"Elapsed: {total_elapsed/60:.1f}m | "
            f"ETA: {eta/60:.1f}m | "
            f"Remaining: {remaining_subs} subs"
        ), "INFO")

log("\n" + "=" * 60, "INFO")
log("PROCESSING COMPLETE", "INFO", verbose=True)
log(f"Total subscriptions processed: {total_subscriptions}", "INFO")
log(f"Total execution time: {time.time()-global_start:.1f}s ({((time.time()-global_start)/60):.1f}m)", "INFO")
log(f"Output file: {CSV_PATH}", "INFO")
log("=" * 60, "INFO")
Drawing Insights With Python (Keras + Pandas)
After we have our CSV full of RAW data we need want to draw insights. When I authored this code what was important to me was to find those subscriptions with high rates of change over time. I am not so fussed about subscriptions with high spend, if they have historically been spending large. What I want to know of is accounts that have increased spend both in absolute dollars and percentage.
So for this we need to break out some core data engineering Python libraries in Pandas, Matplot and Numpy. The following code will analyse azure_cost_report.csv and allow you to draw some quick insights


import pandas as pd
import matplotlib.pyplot as plt
from datetime import datetime
import numpy as np

# Function to parse and analyze the CSV data (updated for wide format)
def analyze_subscription_costs(csv_file):
    # Read the CSV data
    df = pd.read_csv(csv_file)

    # Standardize column names (remove leading/trailing spaces)
    df.columns = [col.strip() for col in df.columns]

    # Identify monthly cost columns (e.g., 'Feb 2025 Cost', ...)
    month_cols = [col for col in df.columns if 'Cost' in col and 'Est.' not in col and 'Savings' not in col]

    # Melt the dataframe to long format
    df_long = df.melt(
        id_vars=['Subscription Name'],
        value_vars=month_cols,
        var_name='Month',
        value_name='Cost'
    )

    # Clean up Month column to just the month (e.g., 'Feb 2025')
    df_long['Month'] = df_long['Month'].str.replace(' Cost', '', regex=False)
    # Parse month to datetime for sorting
    df_long['Month'] = pd.to_datetime(df_long['Month'], format='%b %Y')
    df_long['Cost'] = pd.to_numeric(df_long['Cost'], errors='coerce').fillna(0)

    # Group by subscription and month, summing the costs
    monthly_costs = df_long.groupby(['Month', 'Subscription Name'])['Cost'].sum().reset_index()

    # Get list of unique months and subscriptions
    months = sorted(df_long['Month'].unique())
    subscriptions = df_long['Subscription Name'].unique()

    # Create a results dataframe to store the changes
    results = []

    for subscription in subscriptions:
        # Skip empty subscription names
        if not subscription:
            continue

        # Get data for this subscription
        sub_data = monthly_costs[monthly_costs['Subscription Name'] == subscription]

        if len(sub_data) <= 1:
            continue  # Skip if not enough data for comparison

        # Sort by month
        sub_data = sub_data.sort_values('Month')

        # Calculate first and last month costs
        first_month = sub_data.iloc[0]['Month']
        last_month = sub_data.iloc[-1]['Month']
        first_cost = sub_data.iloc[0]['Cost']
        last_cost = sub_data.iloc[-1]['Cost']

        # Calculate overall change
        absolute_change = last_cost - first_cost
        if first_cost > 0:
            percentage_change = (absolute_change / first_cost) * 100
        elif absolute_change > 0:
            percentage_change = float('inf')
        else:
            percentage_change = 0

        # Calculate month-on-month changes
        mom_changes = []
        for i in range(1, len(sub_data)):
            prev_cost = sub_data.iloc[i-1]['Cost']
            curr_cost = sub_data.iloc[i]['Cost']
            mom_change = (curr_cost - prev_cost) / prev_cost * 100 if prev_cost > 0 else 0
            mom_changes.append({
                'From': sub_data.iloc[i-1]['Month'],
                'To': sub_data.iloc[i]['Month'],
                'Change%': mom_change,
                'ChangeAmount': curr_cost - prev_cost
            })

        results.append({
            'SubscriptionName': subscription,
            'FirstMonth': first_month,
            'LastMonth': last_month,
            'StartCost': first_cost,
            'EndCost': last_cost,
            'AbsoluteChange': absolute_change,
            'PercentageChange': percentage_change,
            'MonthlyChanges': mom_changes
        })

    # Sort results by percentage change (descending)
    results_by_percentage = sorted(results, key=lambda x: x['PercentageChange'], reverse=True)

    # Sort results by absolute change (descending)
    results_by_absolute = sorted(results, key=lambda x: x['AbsoluteChange'], reverse=True)

    return results_by_percentage, results_by_absolute, months

# Function to print the results
def print_results(results_by_percentage, results_by_absolute):
    print("===== SUBSCRIPTIONS RANKED BY PERCENTAGE CHANGE (HIGHEST TO LOWEST) =====")
    for i, result in enumerate(results_by_percentage[:50], 1):  # Top 20
        print(f"{i}. {result['SubscriptionName']}")
        print(f"   Period: {result['FirstMonth']} to {result['LastMonth']}")
        print(f"   Start Cost: ${result['StartCost']:.2f} → End Cost: ${result['EndCost']:.2f}")
        pct = result['PercentageChange']
        pct_str = '∞' if pct == float('inf') else f"{pct:.2f}%"
        print(f"   Change: ${result['AbsoluteChange']:.2f} ({pct_str})")
        print("   Month-to-month changes:")
        for change in result['MonthlyChanges']:
            direction = "▲" if change['Change%'] > 0 else "▼"
            print(f"     {change['From']} → {change['To']}: {direction} ${change['ChangeAmount']:.2f} ({change['Change%']:.2f}%)")
        print()
    print("\n===== SUBSCRIPTIONS RANKED BY ABSOLUTE CHANGE (HIGHEST TO LOWEST) =====")
    for i, result in enumerate(results_by_absolute[:50], 1):  # Top 20
        print(f"{i}. {result['SubscriptionName']}")
        print(f"   Period: {result['FirstMonth']} to {result['LastMonth']}")
        print(f"   Start Cost: ${result['StartCost']:.2f} → End Cost: ${result['EndCost']:.2f}")
        pct = result['PercentageChange']
        pct_str = '∞' if pct == float('inf') else f"{pct:.2f}%"
        print(f"   Change: ${result['AbsoluteChange']:.2f} ({pct_str})")
        print()

# Function to visualize the top changing subscriptions
def plot_top_subscriptions(results_by_absolute, months, n=5):
    # Get top n subscriptions by absolute change
    top_subs = results_by_absolute[:n]

    plt.figure(figsize=(14, 8))

    # For each subscription, plot a line
    for result in top_subs:
        sub_name = result['SubscriptionName']
        monthly_data = {change['To']: change['ChangeAmount'] for change in result['MonthlyChanges']}

        # Extract the months and corresponding costs
        x = [str(m) for m in months if m >= result['FirstMonth'] and m <= result['LastMonth']]
        y = [monthly_data.get(m, 0) for m in months if m >= result['FirstMonth'] and m <= result['LastMonth']]

        plt.plot(x, y, marker='o', linewidth=2, label=f"{sub_name} (${result['AbsoluteChange']:.2f})")

    plt.title('Month-on-month Changes for Top Subscriptions')
    plt.xlabel('Month')
    plt.ylabel('Change Amount (AUD)')
    plt.grid(True, alpha=0.3)
    plt.legend()
    plt.xticks(rotation=45)
    plt.tight_layout()
    plt.savefig('subscription_changes.png')
    plt.show()

# Main execution
csv_file = "azure_cost_report.csv"
results_by_percentage, results_by_absolute, months = analyze_subscription_costs(csv_file)
print_results(results_by_percentage, results_by_absolute)
plot_top_subscriptions(results_by_absolute, months)

# Generate a summary report

def generate_summary_report(results_by_absolute, csv_file):
    # Re-read and melt the data to get month totals
    df = pd.read_csv(csv_file)
    df.columns = [col.strip() for col in df.columns]
    month_cols = [col for col in df.columns if 'Cost' in col and 'Est.' not in col and 'Savings' not in col]
    df_long = df.melt(
        id_vars=['Subscription Name'],
        value_vars=month_cols,
        var_name='Month',
        value_name='Cost'
    )
    df_long['Month'] = df_long['Month'].str.replace(' Cost', '', regex=False)
    df_long['Month'] = pd.to_datetime(df_long['Month'], format='%b %Y')
    df_long['Cost'] = pd.to_numeric(df_long['Cost'], errors='coerce').fillna(0)
    # Calculate total cost per month
    month_totals = df_long.groupby('Month')['Cost'].sum().sort_index()
    # Calculate month-on-month $ and % change
    month_changes = month_totals.diff()
    month_pct_changes = month_totals.pct_change() * 100

    # Calculate month-on-month increase/decrease/unchanged counts for subscriptions
    # Aggregate costs by Subscription Name and Month to avoid duplicates
    grouped = df_long.groupby(['Subscription Name', 'Month'], as_index=False)['Cost'].sum()
    df_pivot = grouped.pivot(index='Subscription Name', columns='Month', values='Cost').fillna(0)
    month_labels = list(df_pivot.columns)
    mom_subs = []
    for i in range(1, len(month_labels)):
        increased = []
        decreased = []
        unchanged = []
        for sub in df_pivot.index:
            prev = df_pivot.loc[sub, month_labels[i-1]]
            curr = df_pivot.loc[sub, month_labels[i]]
            if curr > prev:
                increased.append(sub)
            elif curr < prev:
                decreased.append(sub)
            else:
                unchanged.append(sub)
        mom_subs.append({
            'from': month_labels[i-1].strftime('%B %Y'),
            'to': month_labels[i].strftime('%B %Y'),
            'increased': increased,
            'decreased': decreased,
            'unchanged': unchanged
        })

    # Calculate total change over all months (first to last)
    total_change = month_totals.iloc[-1] - month_totals.iloc[0]
    total_pct_change = (total_change / month_totals.iloc[0]) * 100 if month_totals.iloc[0] != 0 else 0

    total_increase = sum(r['AbsoluteChange'] for r in results_by_absolute if r['AbsoluteChange'] > 0)
    total_decrease = sum(r['AbsoluteChange'] for r in results_by_absolute if r['AbsoluteChange'] < 0)
    net_change = total_increase + total_decrease
    increase_count = len([r for r in results_by_absolute if r['AbsoluteChange'] > 0])
    decrease_count = len([r for r in results_by_absolute if r['AbsoluteChange'] < 0])
    same_count = len([r for r in results_by_absolute if r['AbsoluteChange'] == 0])

    print("\n===== SUMMARY REPORT =====")
    print(f"Total number of subscriptions analyzed: {len(results_by_absolute)}")
    print(f"Subscriptions with increased cost (total duration): {increase_count}")
    print(f"Subscriptions with decreased cost (total duration): {decrease_count}")
    print(f"Subscriptions with unchanged cost (total duration): {same_count}")
    print()
    for mom in mom_subs:
        print(f"{mom['from']} → {mom['to']}: ")
        print(f"  Subscriptions increased: {len(mom['increased'])}")
        print(f"    {', '.join(mom['increased']) if mom['increased'] else 'None'}")
        print(f"  Subscriptions decreased: {len(mom['decreased'])}")
        print(f"    {', '.join(mom['decreased']) if mom['decreased'] else 'None'}")
        print(f"  Subscriptions unchanged: {len(mom['unchanged'])}")
        print(f"    {', '.join(mom['unchanged']) if mom['unchanged'] else 'None'}")
    print()
    for i, (month, total) in enumerate(month_totals.items()):
        month_str = month.strftime('%B %Y')
        if i == 0:
            print(f"{month_str} - Total Cost For All Subscriptions: ${total:,.2f}")
        else:
            change = month_changes.iloc[i]
            pct = month_pct_changes.iloc[i]
            print(f"{month_str} - Total Cost For All Subscriptions: ${total:,.2f} | Change: ${change:,.2f} ({pct:+.2f}%) from prior month")
    print()
    print(f"Total increase amount (subscription level): ${total_increase:.2f}")
    print(f"Total decrease amount (subscription level): ${total_decrease:.2f}")
    print(f"Net change (subscription level): ${net_change:.2f}")
    print(f"Total change in overall cost (all months): ${total_change:,.2f} ({total_pct_change:+.2f}%)")

generate_summary_report(results_by_absolute, csv_file)
Summary
That’s it for part 1, the hard work is in these two snippets of code. One does the harvesting and the other helps make sense of raw data, helping you find those needles in the haystack.
The true value isn’t in the Python code – it’s in the cultural transformation and visibility they provide with builders seeing a direct connections between their architecture choices and financial outcomes.
In Part 2 of this post we will create visual output, making the text output here really pop.
Thanks
Shane Baldacchino
2 thoughts on “Part 1 – Building A Multi-Subscription Azure Savings & Score Card Report – Data Collection & Insights”